Basic HTML Version

Dashboard :
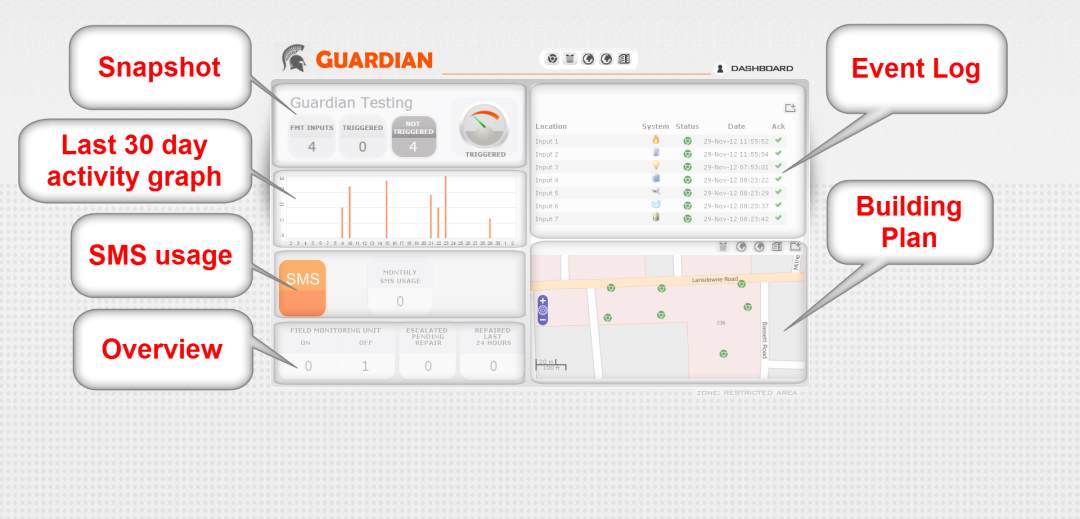
Comprises of 6 panels.
Dashboard
Our primary aim in designing the Dashboard is to make it easy to use and provide you
only with the information you need.
If there is a problem then you can drill down quickly and find out what it is. No need to
leave the Guardian Dashboard to establish what has failed.
We don’t want to waste your time, so we have designed the Guardian so that
“at a
glance”
you know what is going.
The dashboard is there to provide you with a quick overview of the state of the
systems and equipment that is being monitored by Guardian.
The Dashboard comprises of 6 Panels
1. Snapshot
2. Graph
3. SMS Usage
4. Quick Over View
5. Last Event
6. Building or Map View
TIP
1. Guardian refreshes the Dashboard and all panel data every 20 – 60 seconds.
The delay is caused by a combination of:
• the Guardian server processing your information
• the cellphone network delivering the alarm signal to Guardian
• the internet delivering the update information to your web browser

