Basic HTML Version

Dashboard :
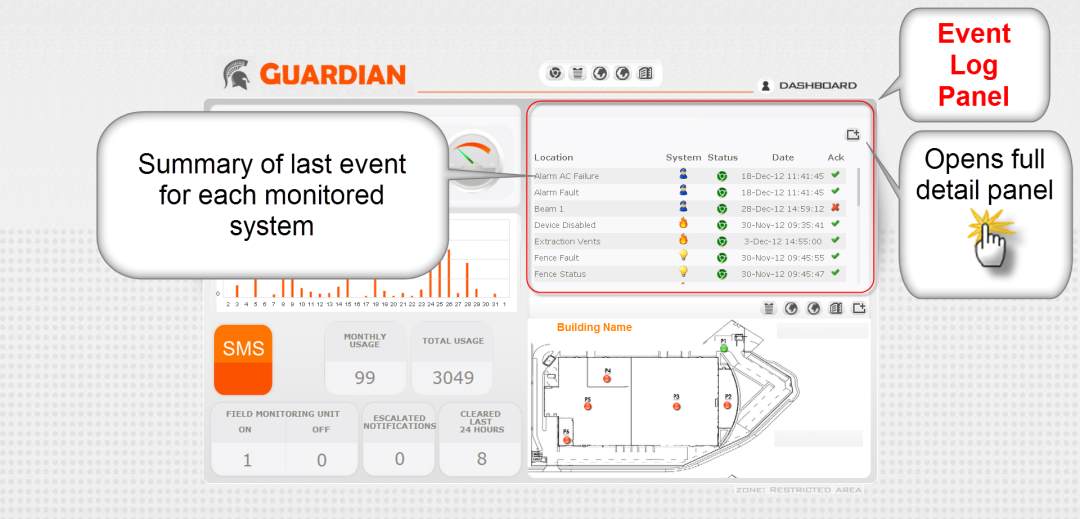
Event Log panel, provides the current status of each
device being monitored.
Dashboard: Last Event
This section of the Dashboard comprises of1 window.
The window displays the current state of each device and a summary of additional
information.
Use the scroll bar on the right hand side of the panel to view all the devices.
View all the details of each device in the “detailed log”.
To open the detailed log, click on the small “ box” in the top right hand corner.
TIP
1. When the notification has been acknowledged, the “red cross” is updated with a ‘
green tick”. In the detailed log the green tick is replaced with the date & time.

